We recreated the experiment "A/B Testing Instant.Page With Netlify and Speedcurve" by Tim Kadlec. See the results in this article.


Recently, I've read the article "A/B Testing Instant.Page With Netlify and Speedcurve" by Tim Kadlec. He measured if instant.page speeds up his website for real users, showcasing how Speedcurve and Netlify features made this very easy.
I decided to recreate this experiment for our documentation site because I was curious if using those small scripts could make a difference on our already very fast site. We are not hosted on Netlify, and we don't use Speedcurve, so I had to write it from scratch.
Hypothesis: Adding Instant.page or Quicklinks will significantly lower page load times for users.
If you are not interested in the technical implementation, jump to the end of the article to see the charts and conclusions.
I used the simplest, naive method of A/B testing:
platformOS uses Liquid markup as a templating engine, so this is where I perform that logic. There is no native filter to randomize numbers, so I used a snipped I found on the internet:
{%- assign min = 1 -%}
{%- assign max = 3 -%}
{%- assign diff = max | minus: min -%}
{%- assign r = "now" | date: "%N" | modulo: diff | plus: min -%}
{% comment %}
r = 1 or r = 2
Save value to session
{% endcomment %}
{% if context.session.test == blank %}
{% session test = r %}
{% endif %}
{% comment %}
Set global variable telling reporter if this result
is for scripted variant or not
Load quicklinks.js
{% endcomment %}
{%- if r == 1 %}
{%- endif %}
First, let's create a model that will hold all data:
name: performance
properties:
  - name: everything
    type: integer
  - name: instantpage
    type: boolean
Its name is performance and it has two properties:
Now we need an endpoint where the browser will send the data:
---
layout: ''
method: post
slug: __performance-report
response_headers: '{ "Content-Type": "application/json" }'
---
{% comment %}
  Parse arguments from JSON to a Hash, so we can iterate over it etc.
{% endcomment %}
{% parse_json arguments %}
{{ context.post_params }}
{% endparse_json %}

{% comment %}
  Using GraphQL mutation, forward data to the database.
{% endcomment %}

{% graphql g, args: arguments %}
mutation create_performance_report($everything: Int!, $instantpage: Boolean!) {
  model_create(
    model: {
      model_schema_name: "performance"
      properties: [
        { name: "everything", value_int: $everything },
        { name: "instantpage", value_boolean: $instantpage }
      ]
    }
  ) {
    id
  }
}
{% endgraphql %}

{% comment %}
  Try to assign errors to errors variable
  Try to get ID of the record saved in the DB
{% endcomment %}

{% assign errors = g | fetch: "errors" | json %}
{% assign id = g | fetch: "model_create" | fetch: "id" | plus: 0 %}

{% comment %}
  If there is ID returned by the server, lets return it as a response
  If there is no ID, lets return errors as a response
{% endcomment %}

{% if id %}
  {
    "id": {{ id }}
  }
{% else %}
  {
    "errors": {{ errors }}
  }
{% endif %}
To send the observed performance values to the above page, we used a simple AJAX request.
const nav = performance.getEntriesByType('navigation')[0];
const DELAY = 100;

const report = (data) => {
  fetch('/__performance-report', {
    method: 'POST',
    headers: {
      'Accept': 'application/json',
      'Content-Type': 'application/json'
    },
    body: JSON.stringify(data),
  })
    .then((res) => res.json())
    .catch(console.log);
};

// Make sure it gets readings after the is ready by pushing it out of main thread
setTimeout(() => {
  const perf = {
    instantpage: !!window.instantpage,
    everything: nav.domInteractive - nav.requestStart,
  };

  if (nav.type === 'navigate') {
    report(perf);
  }
}, DELAY);
And that's it. After deployment, data collection from users started. I let it run for a couple of weeks — now it's time to see the results.
First, we need to pull out the data from the DB. As usual, GraphQL will do the heavy lifting:
query get_performance_report($instantpage: Boolean!) {
  models(
    per_page: 1000
    sort: { created_at: { order: ASC } }
    filter: {
      properties: [
        { name: "instantpage", value_boolean: $instantpage }
        { name: "everything", range: { gt: "0", lt: "4000" } }
      ]
    }
  ) {
    results {
      x: created_at
      y: property(name: "everything")
    }
  }
}
Why I'm not pulling anything above 4000? Because I saw that some outliers would skew the scale on the charts too much and make them much less readable when plotted. I decided to remove extreme values from the dataset.
Now we need a page to show it on. I decided to use the Chart.js library to draw a chart. It's small, simple, and fast. Dashboard page is pretty long, you can see source code on our GitHub.
And the last step: Initialize Chart.js, which was pure pleasure 😃
var el = document.getElementById('comparison');
var ctx = el.getContext('2d');

var chart = new Chart(ctx, {
  type: 'scatter',
  data: {
    datasets: window.datasets,
  },

  options: {
    scales: {
      yAxes: [{
        ticks: {
            suggestedMin: 100,
            suggestedMax: 4000
        }
      }],
      xAxes: [
        {
          type: 'time',
          time: {
            unit: 'day',
          },
        },
      ],
    },
  },
});
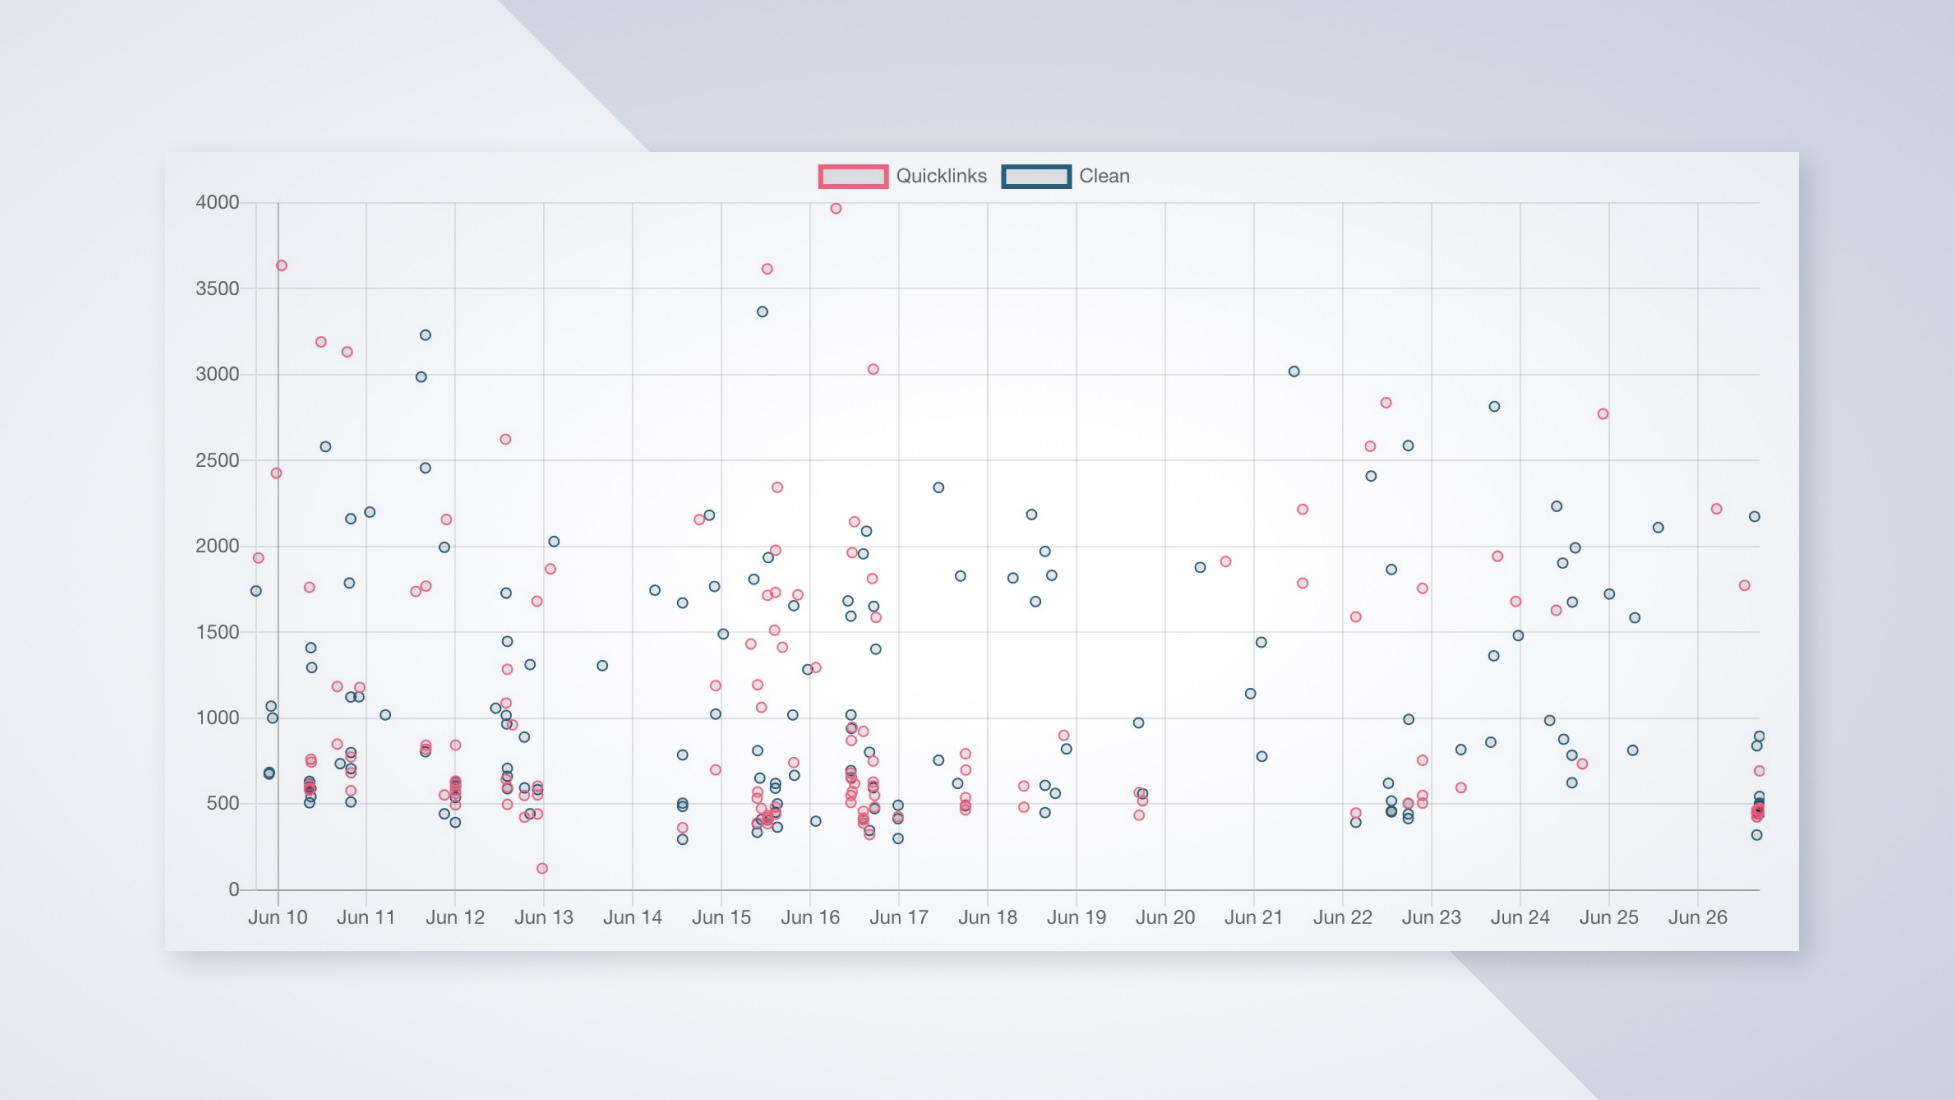
All results on one scatter chart:
It does not look like there is a clear winner here.
Let's look at the largest groups of points where there is only one variant on the chart.
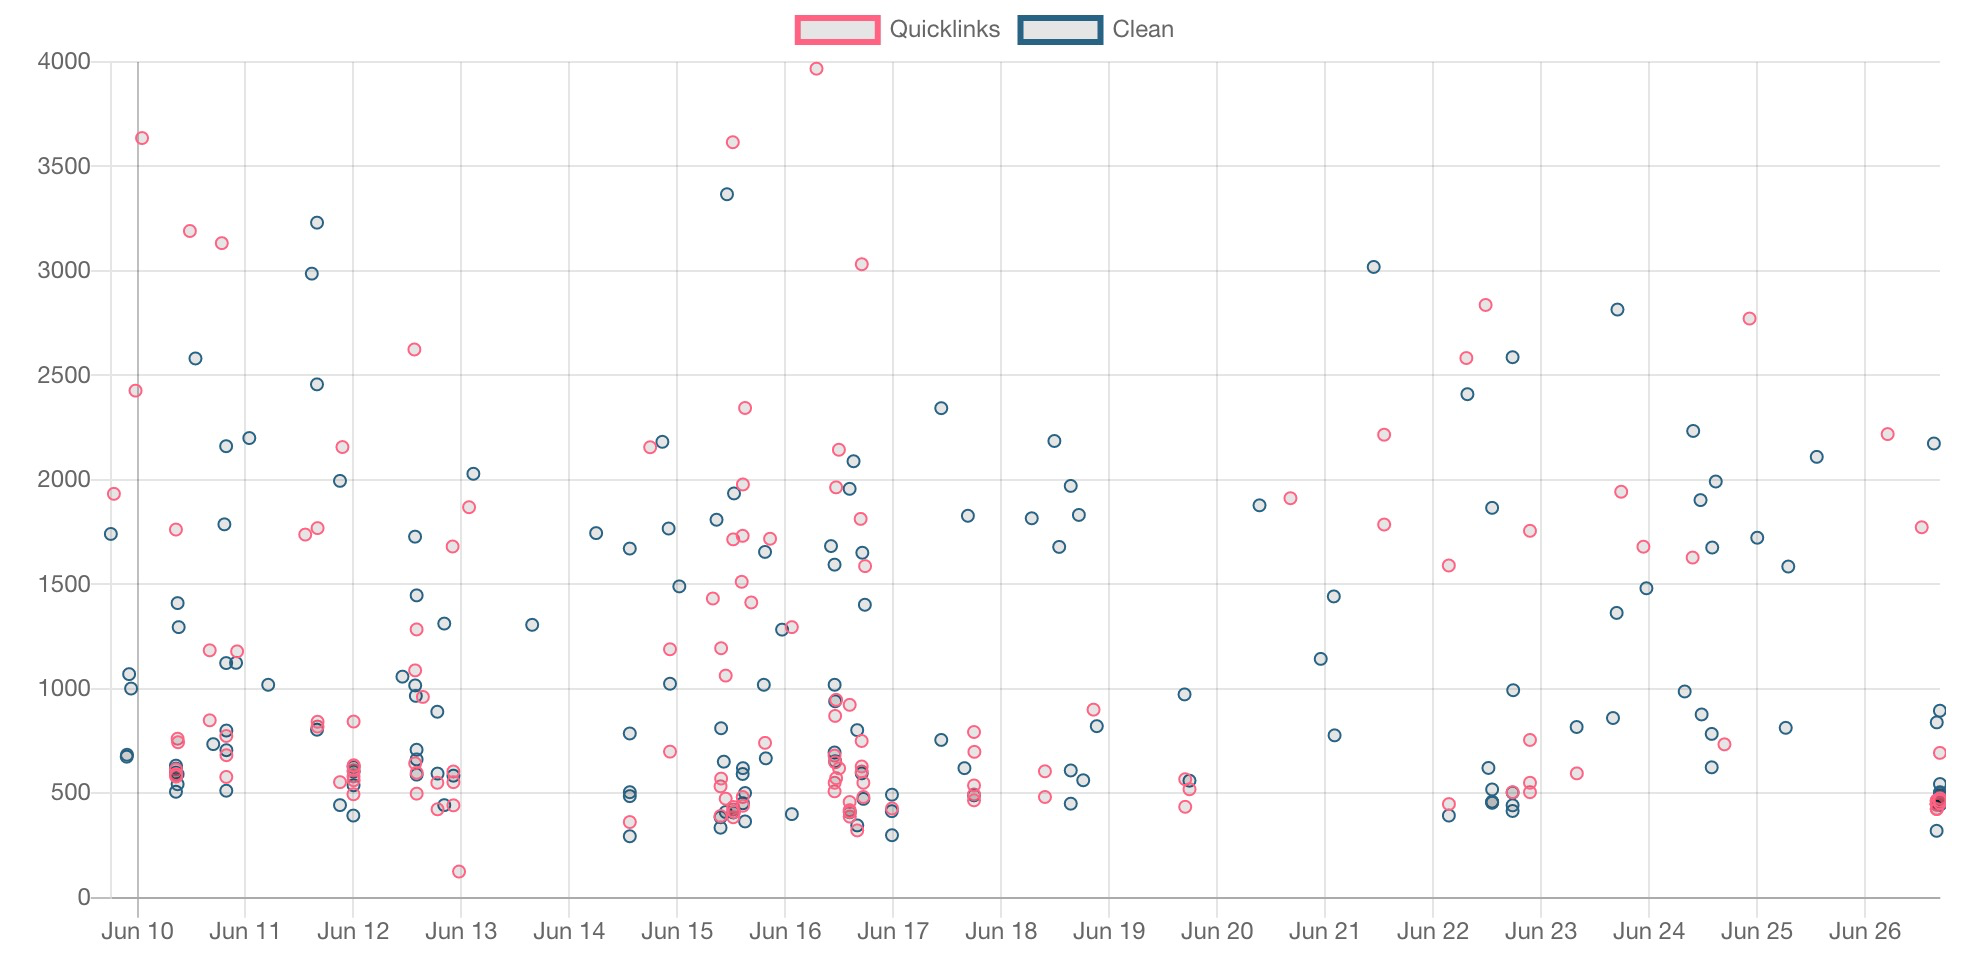
Only clean data points:

Quicklinks data points only:
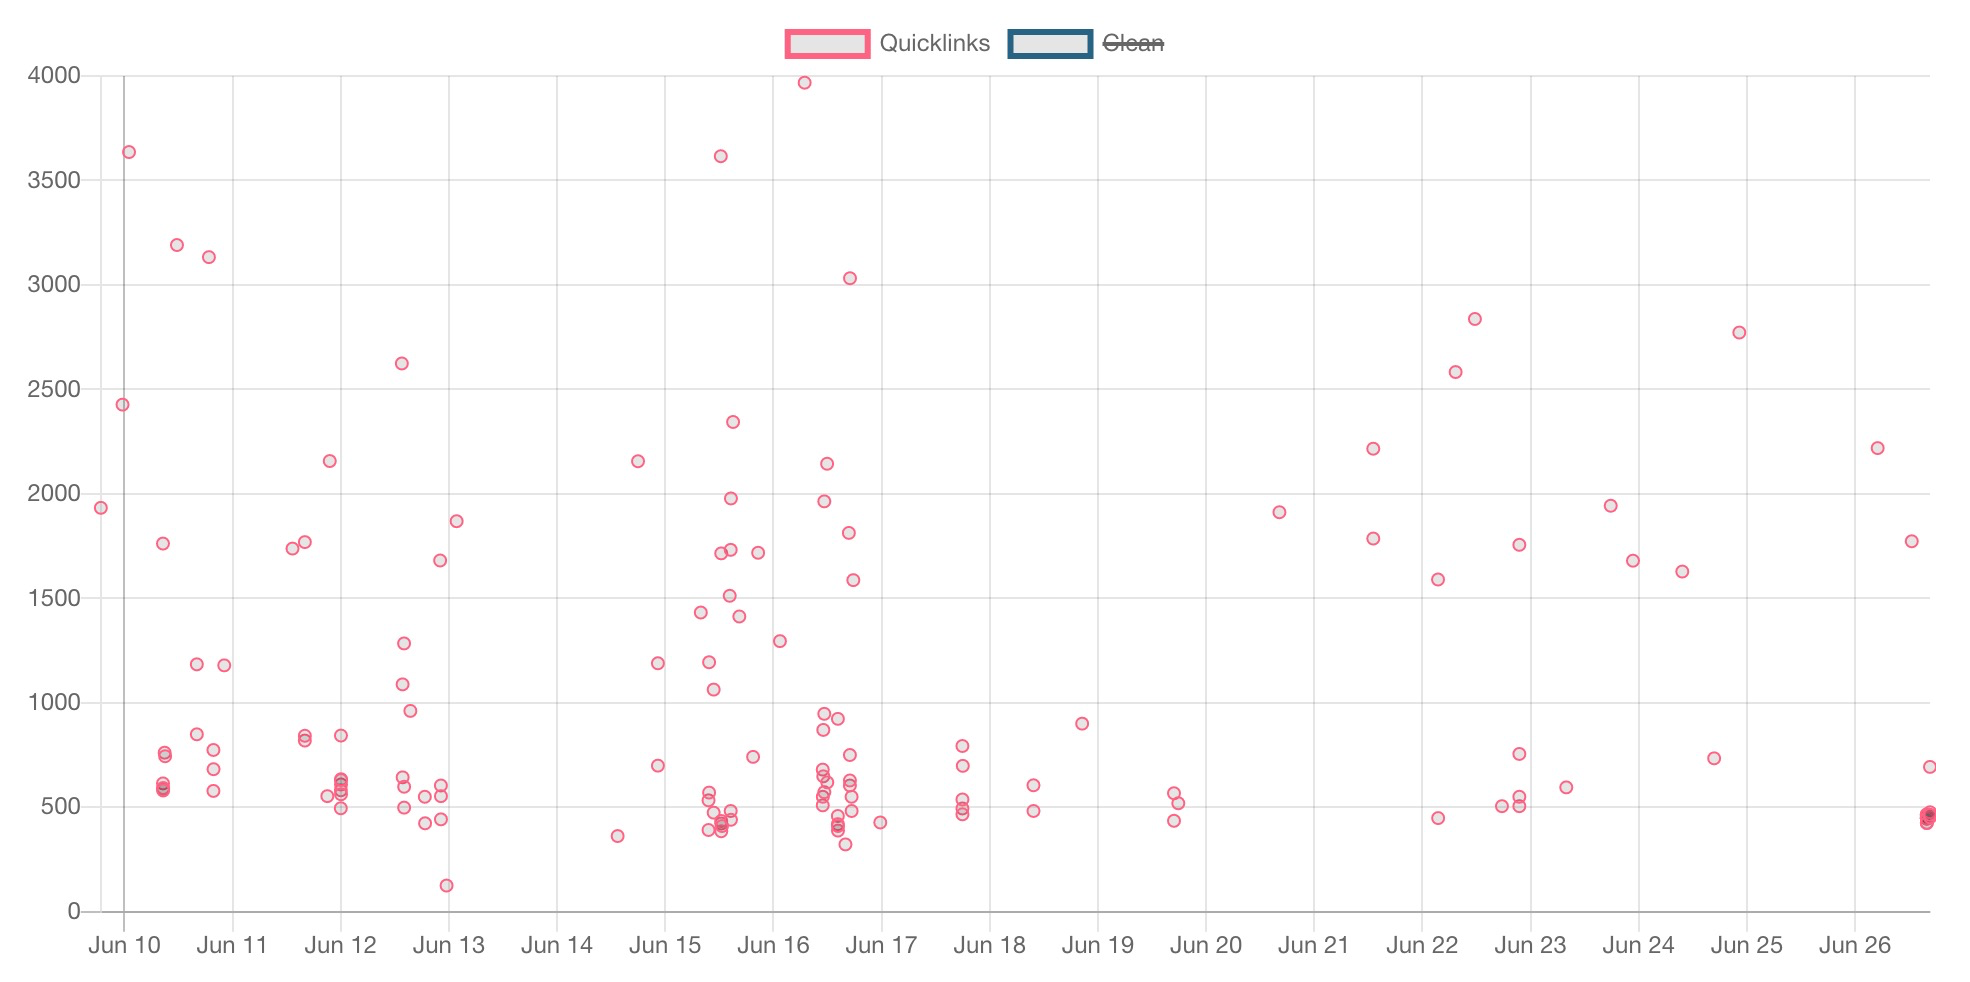
It looks like in both cases, everything takes around 500ms and spreads up to 2000ms.
Our hypothesis was that instant.page (tested in the first week then switched to quicklinks.js) is making websites faster. In our case, it doesn't look like it is working as well as advertised. We decided not to go forward with either script. Sending less JS down the wire and making sure your website is just fast seems like a better bet.
We have reached the point of diminishing returns on our documentation website. It is so fast it is hard to squeeze more out of it. Especially on the frontend without sacrificing features. Nonetheless, I'm glad I did the experiment because it was on my mind for a long time (long before I saw that Tim Kadlec did it) and now I finally know.
Ensure your project’s success with the power of platformOS.